See the full picture across multiple timeframes with our graphs
Compare the same market across multiple timeframes with our innovative chart-splitting feature. Split charts up to four times, and apply the layout that best fits your needs.
With a clear view of different periods, from tick-by-tick to monthly, you’ll be in the best possible position to identify – and react to – significant price movements.

In-depth chart analysis with 32 indicators and 19 drawing tools

Indicators
Make informed trades using state-of-the-art technical analysis tools. With our award-winning platform2, you’ll have access to Bollinger Bands, the MACD, pivot points, and many others.
Add indicators to a selected price chart easily by clicking on the ‘Indicators’ icon on the chart. Alternatively, right click and select ‘Indicators’ from the menu bar.
Drawings
Identify and visualise trends, triangles and wedges, amongst other important chart patterns with drawings.
Select the object you want from the ‘Drawings’ icon on the chart (or right click on the chart and select ‘Drawings’ from the menu). Our drawing objects include Fibonacci retracements and extensions, Elliott Waves, channels, and more.


Lightning-fast live graphs
Enjoy an effortless trading experience with our HTML5 technology. You can split charts, apply as many indicators as you like and add your own annotations, all without sacrificing speed or stability.
Our charts are designed to perform on any browser – though we recommend Google Chrome for the very best experience.
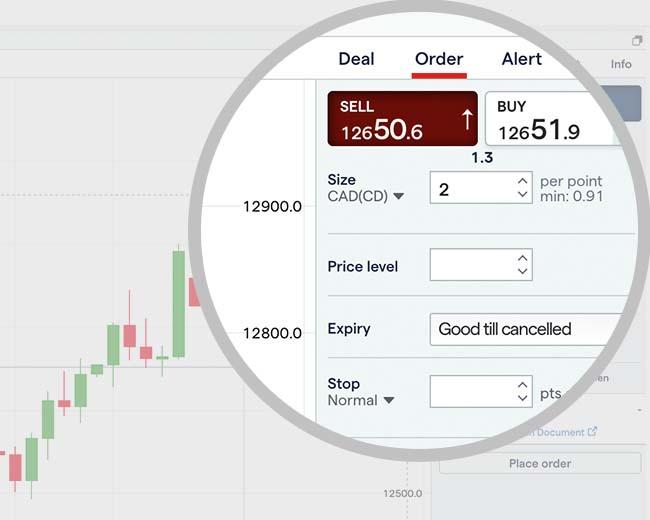
Trade direct from your charts
React faster than ever to new opportunities in the markets, by trading directly from charts. Open, close and edit positions in a couple of clicks with our easy-to-use functionality – and choose one-click trading to take positions instantly.
Our platform is designed to make it as quick as possible for you to respond to key market movements – especially from our charts.
What are the types of trading charts and how do you read them?
(1) Candlestick chart :
Candlestick charts display pricing information in long, thin bars that resemble candles. Each candlestick shows price movement over the period of time you selected. At a glance, a green candlestick indicates that the market moved up in price over the given period, closing at a higher price than it opened. A red candlestick, on the other hand, indicates that the market's price decreased, closing at a lower price than it opened.
Candlesticks give you information about four key price variables:
- Open – the price at the start of the period
- Close – the price at the end of the period
- High – the highest price traded during the period
- Low – the lowest price traded during the period
The relationship between the four prices shown by a candlestick can tell you a great deal about how market conditions are shaping up and who is driving the price action: buyers or sellers.
(2) Heikin-Ashi :


On first encounter, Heikin-Ashi bars may look very similar to the candlestick chart. But, there is a significant difference between the two. Heikin-Ashi, which more or less translates from Japanese as ‘average pace’, gives you an indication of price averages – and their changes – over a period.
Heikin-Ashi charts are smoother than candlesticks and, rather than offering an exact price at any moment, are often looked to for determining general trends over longer timeframes. The opening price of a Heikin-Ashi bar is the mid-point of the previous bar, and the closing price equals the average price for the current time period.
In short, each Heikin-Ashi bar shows you the direction and magnitude of every period’s change in average price level. For example, a long green bar will indicate that the average price has increased substantially. Conversely, a long red bar tells you that the average price in the market has dropped significantly.
(3) HLOC chart (bar chart) :


The next type of chart, HLOC, which stands for ‘high, low, open, close’, shows exactly the same data as a candlestick chart, but in a different way:
- The open price is represented by the horizontal notch to the left of the vertical line
- The close price is represented by the horizontal notch to the right of the vertical line
- The high price is the uppermost point of the vertical line
- The low price is the lowest point of the vertical line
(4) Line chart :


Unlike a candlestick or HLOC chart, a line chart only shows the close
price for the time period you have selected (eg one hour). The close
prices are joined together so that the consecutive points form a line.
This is a very simple way to display pricing data as it does not give any indication of what the high, low or open price for the period was. For this reason, many traders only use line charts when assessing long-term trends, where some of the additional information may not be quite as relevant as it is when trading short-term patterns.
When trading short-term volatility, such as in a highly liquid forex
market, you’ll want to know the extent and pace of price movements, as
well as the exact price of the market at any given moment – meaning that
a candlestick or HLOC bar chart will be a better source of data.
(5) Mountain chart :


The final type of chart is a mountain chart. This is the same as a
line chart, except the area beneath the line is shaded, giving it the
appearance of a mountain in silhouette. Like line charts, this type is
mainly used to assess long-term trends, as the high, low and open prices
for each period are not on show.
The shaded ‘mountain’ gives you a quick impression of the shape of the market and its volatility – frequent peaks and valleys, with steep gradients, indicate higher levels of volatility, while smoother gradients suggest more stability.
Technical indicators that are drawn directly onto charts – Bollinger
bands, for example – may be easier to read when applied to mountain or
line charts than candlesticks and HLOC bars.
Free trading charts on the best platform :
(1) Web-based platform :


Access top-quality charts and key indicators for over 17,000 markets.
Make informed decisions with the No. 1 CFD trading platform1 – a faster, clearer and smarter way to trade.
(2) Mobile trading app :

Charts on-the-go, wherever you are, whenever you want. Access thousands
of markets – including stocks, forex and indices – with an award-winning
trading app.2
(3) MetaTrader 4 :

Analyse the markets and customise your MetaTrader 4 experience with our range of free indicators and add-ons
(4) ProRealTime :


================================================================================
Comments
Post a Comment